

|
Comparison of Regions Indicators for In-house Operations |
Switzerland |
Europe / Middle East |
Americas |
Asia-Pacific |
Overall Consumption 2013 |
Change to 2012 |
Indicator per FTE 2013 |
|---|---|---|---|---|---|---|---|
|
Premises Energy Consumption in MWh |
234'800 |
144'800 |
202'300 |
67'700 |
649'600 |
-6% |
13'870 kWh |
|
Business Travel in mio km |
52.7 |
139.1 |
209.2 |
127.4 |
528.3 |
-6% |
11'280 km |
|
Paper consumed in tons |
3'680 |
640 |
580 |
310 |
5'200 |
-8% |
111 kg |
|
Water consumed in m3 |
503'200 |
230'500 |
341'600 |
162'700 |
1'238'000 |
-11% |
26 m3 |
|
Waste produced in tons |
5'470 |
1'470 |
3'760 |
930 |
11'620 |
-13% |
248 kg |
|
Losses of Coolants and Fire Extinguishers in kg |
200 |
660 |
280 |
750 |
1'890 |
-4% |
40 grams |
|
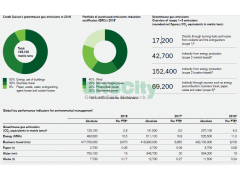
Greenhouse Gas Emissions gross in metric tons CO2 equivalents |
35'950 |
48'160 |
137'150 |
73'180 |
294'440 |
-15% |
6'290 kg |
|
Offsetted Greenhouse Gas Emissions gross in metric tons CO2e |
35'950 |
48'160 |
137'150 |
73'180 |
294'440 |
|
|
|
Comparison of Periods Indicators for In-house Operations |
GRI and GHG-Protocol Indicators |
Overall Consumption 2011 |
Overall Consumption 2012 |
Overall Consumption 2013 |
Indicator per FTE 2011 |
Indicator per FTE 2012 |
Indicator per FTE 2013 |
|---|---|---|---|---|---|---|---|
|
Premises Energy Consumption in MWh / kWh per FTE |
EN 3 / 4 |
710'900 |
688'000 |
649'600 |
14'010 |
14'690 |
13'870 |
|
Business Travel in mio km / km per FTE |
EN 29 |
602.0 |
561.9 |
528.3 |
11'860 |
11'990 |
11'280 |
|
Paper consumed in tons / kg per FTE |
EN 1 |
6'340 |
5'650 |
5'200 |
125 |
120 |
111 |
|
Water consumed in m3 / m3 per FTE |
EN 8 |
1'331'800 |
1'384'600 |
1'238'000 |
26 |
30 |
26 |
|
Waste produced in tons / kg per FTE |
EN 22 |
14'100 |
13'380 |
11'620 |
278 |
286 |
248 |
|
Losses of Coolants and Fire Extinguishers in kg / grams per FTE |
EN 19 |
1'944 |
1'966 |
1'890 |
38 |
42 |
40 |
|
Greenhouse Gas Emissions gross in metric tons CO2e / kg per FTE |
Scope 1-3 |
386'110 |
347'1804 |
294'440 |
7'610 |
7'4104 |
6'290 |
|
Savings through electricity from renewable sources in the UK |
|
|
16'960 |
16'230 |
|
|
|
|
Greenhouse Gas Emissions net offset in metric tons CO2e |
|
386'110 |
330'220 |
278'210 |
|
|
|
- Energy consumption is presented in MWh and not in MJ. One megawatt hour (MWh) equals 3,6 mega joule (MJ), rounded figures
1 Verein für Umweltmanagement und Nachhaltigkeit in Finanzinstituten e.V.
2 Global Reporting Initiative; www.globalreporting.org
3 Greenhouse Gas Protocol; www.ghgprotocol.org
4 Greenhouse gas emissions (GHG) for 2012 were updated because the DEFRA Guidelines for the assessment of GHG emissions from electricity usage in the UK were revised. During this process, the findings from the recording of data in 2013 were applied to the year 2012 - leading to adjustments in the basic data. The 2013 footprint of the EMEA region was reduced by 36'833 tons CO2e by taking accout of an additional surplus of renewable electrity certificates (GO Switzerland) of 41.9 GWh.
https://www.credit-suisse.com/responsibility/en/environment/performance.jsp